2.1 Graphing Tutorial 
In (plotutils graph), there is one monolithic graphing function
called graph with dozens of options. We’ll demonstrate a couple
of them in this tutorial.
2.1.1 Graphing Functions 
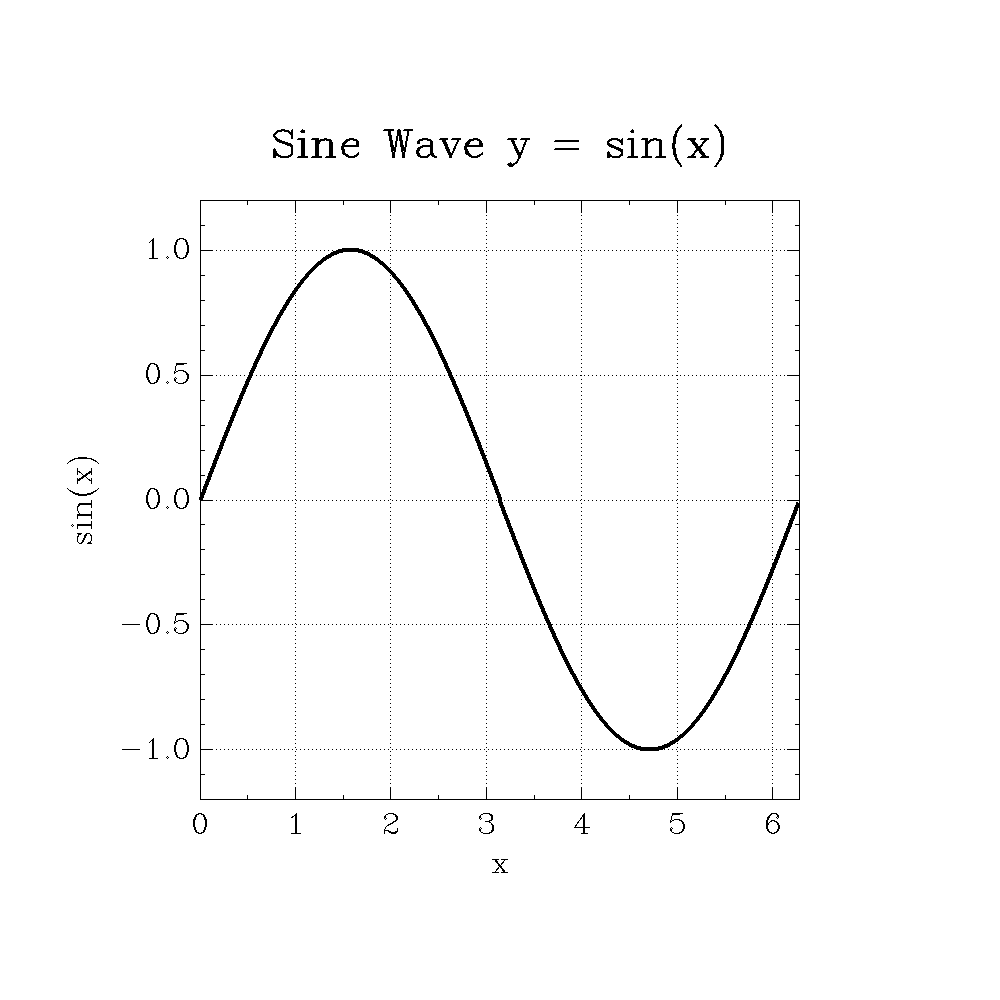
First let’s explore how to graph mathematical functions. Let’s say you have a mathematical function to plot such as “sin(x)”. This example script calls graph with three arguments.
- A procedure of one numerical argument that returns a numerical value
- The start of the X range
- The end of the X range
;;; graph-sine-wave.scm — Sine function over one full period
;;; y = sin(x), sampled densely on [0, 2π].
;;; This is the canonical periodic waveform used in trigonometry,
;;; signal processing, and Fourier analysis.

(use-modules (srfi srfi-1)
             (plotutils graph))

(define pi (* 4.0 (atan 1.0)))

(define (output-format-from-filename path)
  (let loop ((i (- (string-length path) 1)))
    (cond
     ((< i 0) "svg")
     ((char=? (string-ref path i) #\.)
      (let ((ext (string-downcase (substring path (+ i 1) (string-length path)))))
        (if (string=? ext "eps") "ps" ext)))
     (else (loop (- i 1))))))

(define (main args)
  (let* ((output-file (if (> (length args) 1) (cadr args) "graph-sine-wave.svg"))
         (output-format (output-format-from-filename output-file))
         (n 600)
         (xmin 0.0)
         (xmax (* 2.0 pi))
         (step (/ (- xmax xmin) n))
         (xs (iota n xmin step))
         (ys (map sin xs)))
    (with-output-to-file output-file
      (lambda ()
        (graph xs ys
               #:output-format output-format
               #:bitmap-size "1000x1000"
               #:top-label "Sine Wave y = sin(x)"
               #:x-label "x"
               #:y-label "sin(x)"
               #:x-limits (list 0.0 (* 2.0 pi))
               #:y-limits '(-1.2 1.2)
               #:grid-style 3
               #:line-width 0.004
               #:font-name "HersheySerif"))
      #:binary #t)))

(main (command-line))
The script samples a few hundred points of the procedure and plots the result.
You can also call graph with four arguments. In that case, the
fourth argument is the step size on the x-axis.
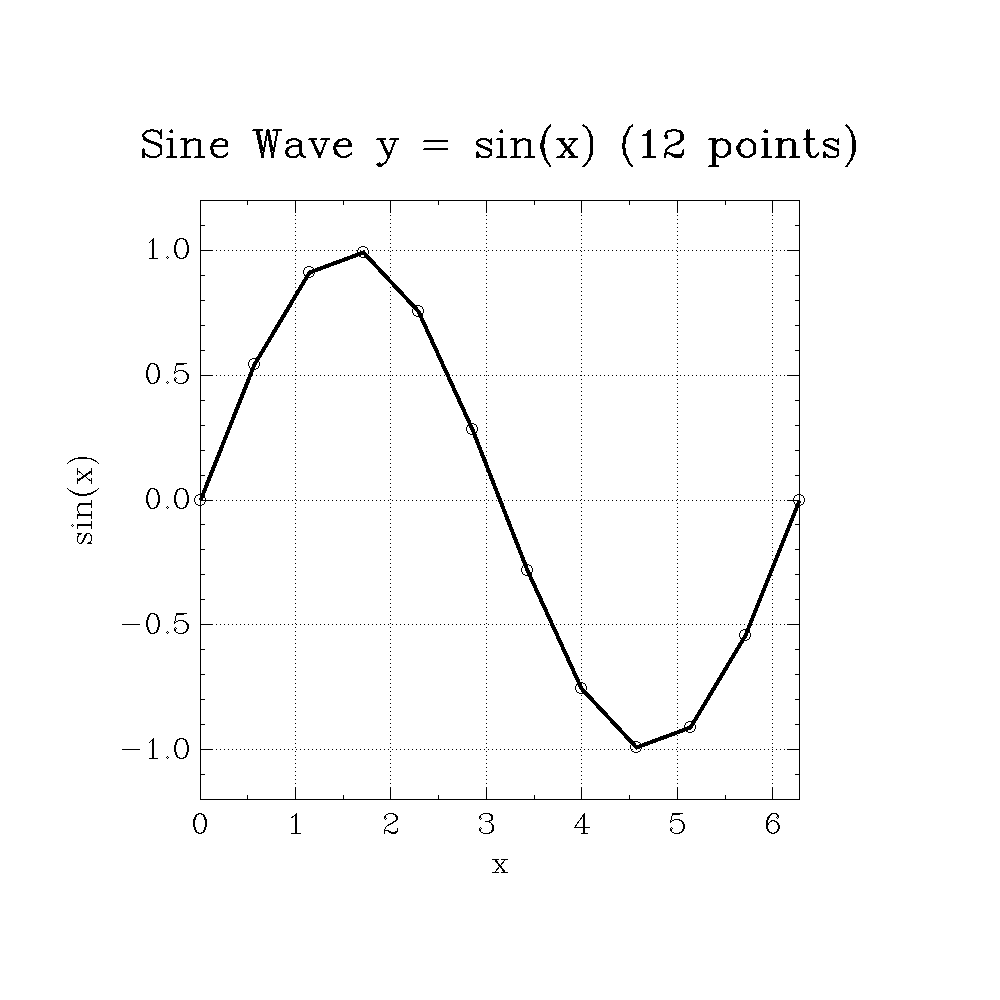
Here’s the same plot with just a dozen sample points
;;; graph-sine-wave2.scm — Sine function with only a dozen points
;;; y = sin(x), sampled sparsely with 12 points across [0, 2π].
;;; This illustrates how low sampling density affects the visual
;;; approximation of a smooth periodic function.

(use-modules (srfi srfi-1)
             (plotutils graph))

(define pi (* 4.0 (atan 1.0)))

(define (output-format-from-filename path)
  (let loop ((i (- (string-length path) 1)))
    (cond
     ((< i 0) "svg")
     ((char=? (string-ref path i) #\.)
      (let ((ext (string-downcase (substring path (+ i 1) (string-length path)))))
        (if (string=? ext "eps") "ps" ext)))
     (else (loop (- i 1))))))

(define (main args)
  (let* ((output-file (if (> (length args) 1) (cadr args) "graph-sine-wave2.svg"))
         (output-format (output-format-from-filename output-file))
         (n 12)
         (xmin 0.0)
         (xmax (* 2.0 pi))
         (step (/ (- xmax xmin) (- n 1)))
         (xs (iota n xmin step))
         (ys (map sin xs)))
    (with-output-to-file output-file
      (lambda ()
        (graph xs ys
               #:output-format output-format
               #:bitmap-size "1000x1000"
               #:top-label "Sine Wave y = sin(x) (12 points)"
               #:x-label "x"
               #:y-label "sin(x)"
               #:x-limits (list 0.0 (* 2.0 pi))
               #:y-limits '(-1.2 1.2)
               #:grid-style 3
               #:line-width 0.004
               #:symbol '(4 0.03)
               #:font-name "HersheySerif"))
      #:binary #t)))

(main (command-line))
2.1.2 Graphing Data 
In the previous section, we explored how to call graph when
the first argument was a function.
In this section we’ll be calling graph using lists of data. When
using data, you either call graph with a single list of data, or
create an xy plot using two lists of data.
(define x (list -1 0 1 2 3 4 5))
(define y (list 1 2 1 2 1 2 1))
;; Plot the y data with an automatic abscissa
(graph y)
;; Plot the x,y pairs
(graph x y)
You can also plot multiple graphs on the same axes using the merge
helper procedure.
(define x1 (list -1 0 1 2 3 4 5))
(define y2 (list  1 2 1 2 1 2 1))
(define x2 (list -1 0 1 2 3 4 5))
(define y2 (list  8 7 6 5 4 3 3))
(graph (merge x1 x2) (merge y1 y2))