2.2 Plotting Tutorial 
The (plotutils plot) library has a set of graphing primitives
that are used by the graphing library. They can be used on their own
for drawing.
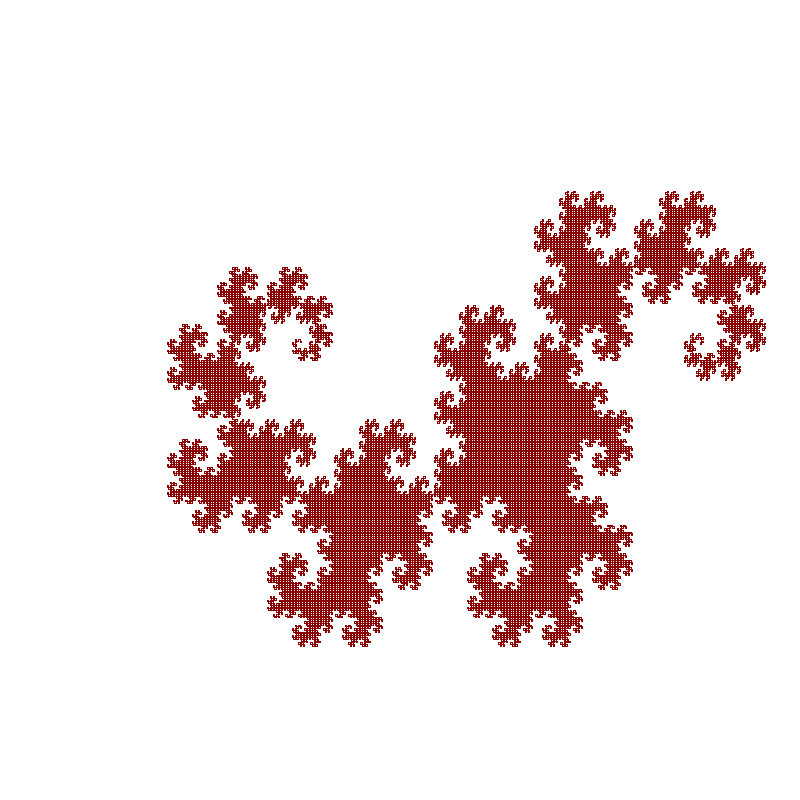
;;; ex-plot-dragon-curve.scm — The Dragon Curve (Heighway Dragon)
;;; Discovered by physicist John Heighway and described by Martin Gardner,
;;; the dragon curve is a self-similar fractal.  It can be generated by
;;; repeatedly folding a strip of paper in half.  Its boundary is a fractal
;;; with Hausdorff dimension 2 (it is space-filling in the limit).
;;; The unfolding sequence follows the Regular Paper Folding Sequence.

(use-modules (plotutils plot))

(define pi (* 4.0 (atan 1.0)))

(define *plotter* #f)
(define *angle* 0.0)
(define *x* 0.0)
(define *y* 0.0)

(define (turtle-forward! dist)
  (let ((nx (+ *x* (* dist (cos (* *angle* (/ pi 180.0))))))
        (ny (+ *y* (* dist (sin (* *angle* (/ pi 180.0)))))))
    (cont! *plotter* nx ny)
    (set! *x* nx)
    (set! *y* ny)))

(define (turtle-left! degrees)
  (set! *angle* (+ *angle* degrees)))

(define (turtle-right! degrees)
  (set! *angle* (- *angle* degrees)))

(define (dragon-left depth length)
  "Draw dragon curve turning left at this level."
  (if (= depth 0)
      (turtle-forward! length)
      (begin
        (dragon-left (- depth 1) (/ length 1.41421356))
        (turtle-left! 90)
        (dragon-right (- depth 1) (/ length 1.41421356)))))

(define (dragon-right depth length)
  "Draw dragon curve turning right at this level."
  (if (= depth 0)
      (turtle-forward! length)
      (begin
        (dragon-left (- depth 1) (/ length 1.41421356))
        (turtle-right! 90)
        (dragon-right (- depth 1) (/ length 1.41421356)))))

(define (output-format-from-filename path)
  (let loop ((i (- (string-length path) 1)))
    (cond
     ((< i 0) "svg")
     ((char=? (string-ref path i) #\.)
      (let ((ext (string-downcase (substring path (+ i 1) (string-length path)))))
        (if (string=? ext "eps") "ps" ext)))
     (else (loop (- i 1))))))

(define (main args)
  (let* ((output-file (if (> (length args) 1) (cadr args) "plot-dragon-curve.svg"))
         (output-format (output-format-from-filename output-file))
         (fp (open-output-file output-file #:binary #t))
         (param (newplparams)))
    (setplparam! param "BITMAPSIZE" "800x800")
    (let ((plotter (newpl output-format fp (current-error-port) param)))
      (set! *plotter* plotter)
      (openpl! plotter)
      (space! plotter -100.0 -200.0 700.0 500.0)
      (linewidth! plotter 0.3)
      (erase! plotter)
      (pencolorname! plotter "dark red")

      (set! *x* 200.0)
      (set! *y* 200.0)
      (set! *angle* 0.0)
      (move! plotter *x* *y*)

      (dragon-left 16 400.0)

      (closepl! plotter)
      (close fp))))

(main (command-line))
The script draws a fractal pattern of c curves.